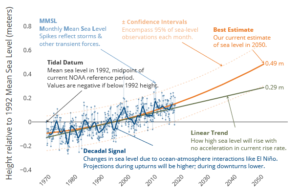
Researchers at the Virginia Institute of Marine Science (VIMS) have developed a yearly report card to gauge sea-level trends around the country. As annual tide-gauge data becomes available, the report card shows trends and projected sea-level rise to 2050 in 32 localities along all US coasts.
Each report card shows recent trends, projections, and explanations of how sea level is affected in each area. In this example from Norfolk, Virginia, it briefly explains how the projection was devised. Each locality has information like this, and the projections can even be compared to other areas. Check it out.