
The Chesapeake Bay’s coastline in Virginia and Maryland stretches 11,885 miles long. Researchers from the Virginia Institute of Marine Science (VIMS) have spent almost 50 years mapping huge swaths of the coastline of the Bay, and they recently published the latest version online. The maps are capable of displaying features such as boat houses and marinas, critical habitat such as tidal marshes, land use practices such as agricultural fields, and management tools such as sea level rise inundation levels.
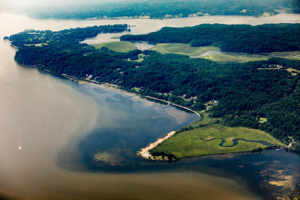
The Potomac River in Stafford County, Virginia. Credit: Will Parson/Chesapeake Bay Program
The maps were developed by VIMS’ Center for Coastal Resources Management using aerial photography, GPS, and lots of field work. Carl Hershner, CCRM Director, has been on the project since it began in 1972. At that time, VIMS had a large staff working on inventorying wetlands and providing technical advice to coastal managers. Many scientists and managers were focused on wetlands as a support tool for fisheries.
In 1972, VIMS wrote a report to the Virginia General Assembly on the importance of tidal wetland protection to fisheries and flood buffering. The GA supported the report and mandated that VIMS establish an inventory of wetlands along the state’s coast. Scientists set out in boats to survey the species composition, location, and size of every wetland.
In the late 80’s, erosion was becoming a massive problem at Virginia Beach, and many coastal residents wanted to build bulkheads. The state legislature again turned to VIMS to help devise a solution. The scientists were asked to develop an inventory of the entire Virginia shoreline. The state funded half of the project, and VIMS pulled together multiple other sources to fund the rest of the project. The maps were updated as technology advanced every 5-10 years, with the last update taking 10 years, finishing in 2018.
Meanwhile, Maryland took interest in the project, and in 1992 completely funded an effort to inventory the state’s coastline which was completed in two years. Hershner said that funding “remains a challenge, but we’re making the case.”
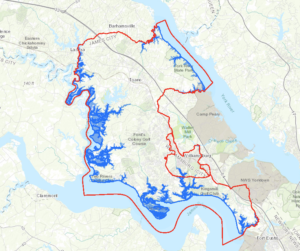
Map showing sea level rise in 2020 in Williamsburg, Virginia. All of the maps are free online.
The first-of-its-kind inventory is completely accessible online, allowing each of Virginia’s 44 coastal localities access to map-viewers, sea level rise vulnerability tools, historic maps, GIS data, and locally-specific recommendations for shoreline best management practices.
While the maps available today allow viewers to see such details as individual docks and shoreline structures, maps were not always as detailed. In the 70’s, the team used topographical maps from USGS and an optical surveying instrument called a theodolite and using these tools made shoreline mapping extremely slow. In the 80’s, digital mapping and GPS tools became available, allowing researchers to map the shoreline by boat and record species composition. Marcia Berman joined CCRM in 1989 to lead this effort. She explained that back in the lab they would compare their GPS data with aerial photography to digitize the shorelines’ position and the features they surveyed in the field. The work took thousands of hours. Today’s aerial imagery is accurate down to less than a meter, allowing scientists to spend less time in the field, and map more accurately from the desktop.
The maps provide high-value data to managers and policy-makers along the entire Virginia coastline. They have been used for permitting decisions, climate change adaptation, and shoreline and risk evaluations for homeowners. Scientists can also use the maps to study the ecological functions of shorelines and changes in ecosystem services. “This is the best data set for not just our people but people at other institutions looking at what’s happening in different habitats,” Hershner explained.
Their process is gaining attention from government agencies like NOAA and organizations like The Nature Conservancy. Berman is partnering with NOAA on a similar project in the Gulf of Mexico, creating a living shoreline model for Texas, Louisiana, Florida and Alabama. Often, it is environmental groups or agencies that are most interested in these tools. “We are not just getting interest from regulators and shoreline managers,” explained Berman. “I’m getting the groups who want to restore wetlands for ecological value and enhance coastal resilience.”
The team has just begun working on updating the maps in Maryland. Through the years, technology has played a significant role in their capacity to map and detect features in the coastal zone. LiDAR is now being used collect data on bank height and nearshore habitat. “If we have the ability to look at vegetation changes and species composition, that would really change the way we could interpret and predict change in species as an indicator of climate,” Berman said. “To really do that properly, hyper-spectral imagery is necessary, but the technology in the remote sensing world is still relatively expensive.”
Hershner and Berman hope that Virginia will prioritize mapping efforts and vulnerability assessments as the Chesapeake Bay continues to change at a rapid pace. “I don’t think we do a very good job of integrated management in Virginia,” Berman explained. “You’re looking at a landscape that is moving inland and you’ve got to be able to manage across jurisdictions.” In the face of climate change, researchers and managers need to think outside the box and manage creatively. Hershner added, “In order to do that we need to know what’s out there and where it is. The bottom line in the Chesapeake Bay is that it can’t be what it once was. What’s possible in the future will be different than what we have now, and that’s an immediate challenge.”