
ODU Researchers Study Nutrient Pollution During King Tide
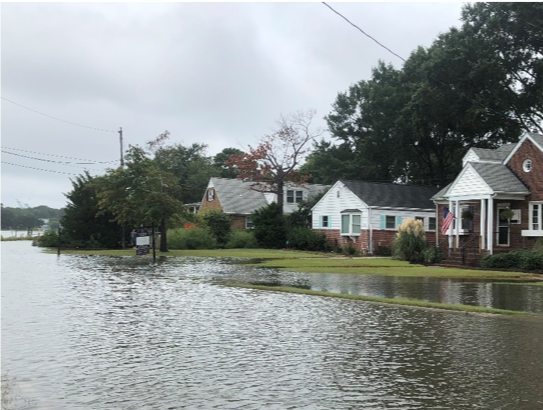
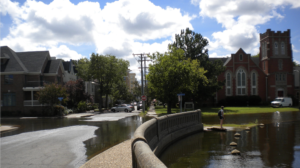
Flooding in Larchmont, Norfolk, VA.
The incidence of coastal flooding has increased as a result of sea level rise. Last October, researchers from the Ocean, Earth and Atmospheric Sciences Department at Old Dominion University led about 70 volunteers out to the Lafayette River to measure the water levels and take water quality samples during the King Tide flooding event. Professor Margaret Mulholland and her graduate student Alfonso Macias Tapia called their sampling effort “Measure the Muck,” piggy-backing off of the “Catch the King” event happening at the same time. The goal was to quantify nutrient pollution that flood-waters were bringing back to the river when it receded from the high tide.
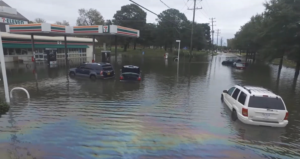
Flooding in Norfolk following Hurricane Matthew.
In 2017, Hampton Roads conducted its first major flood mapping exercise during the highest astronomical tide predicted for the year, the “King Tide”. Catch the King engaged thousands of citizen scientists to map the extension of the high tide during this event. Mapping was done using the Sea Level Rise phone application developed for Wetlands Watch, a nonprofit whose mission is coastal adaptation to sea level rise. The Sea Level Rise app allows users to map the extent of flood-waters by dropping pins while walking along the water’s edge and at other sampling locations.
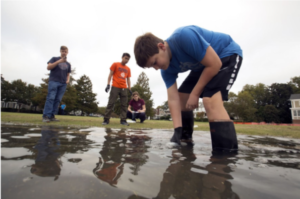
High school volunteers, a PhD student, and a 12th grader sampling during MTM 2017.
Mulholland, who studies harmful algal blooms at ODU, wanted to take advantage of the manpower harnessed as part of the Capture the King event to measure pollutants and nutrients the tide was carrying into the Lafayette River, a sub-tributary of the southern Chesapeake Bay. “If they are already going out and mapping the tide, why not collect water samples and see how much junk is in the water,” she explained. Then, knowing the concentration of nutrients in the flood-water and the volume of flood-waters, they would be able to calculate the nutrient load to the river due to coastal flooding.
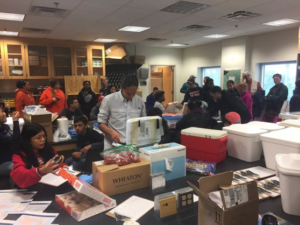
Macias Tapia, standing in middle, with a group of volunteers at MTM 2018.
Mulholland and Macias Tapia advertised the event at ODU, recruiting graduate students, undergraduates, and faculty members as volunteers. They also recruited from AP Environmental Science classes and a STEM specialty program at two Norfolk Public School high schools and their teachers, rounded out their team. Volunteers were trained prior to the flood and on then on the day of the King Tide, the volunteers were broken up into groups of 3-4, supplied with sampling kits, coolers, and maps, and deployed into the local watershed. One volunteer would map the water line using the phone app, a second person would take a water sample, a third would drop a pin, make a note of the sample bottle number, and take a picture of the water where the sample was collected, and the last took coordinates and notes on paper as backup. After an hour or two, the volunteers brought all the samples back to Mulholland’s laboratory and Macias Tapia supervised their processing, storage, and analysis.
Flooding near ODU.
In 2018, Mulholland and Macias Tapia had more volunteers but “were more focused on a smaller area,” said Macias Tapia. This allowed them to get higher resolution data on the nutrient concentrations in the flood waters. The preliminary results from 2018 appear to confirm what they found in 2017.
Of the samples the ODU team collected, only two met EPA’s recreational water quality criteria in 2017, and 3 met the criteria this 2018. In many of the samples, Enterococcus, or fecal bacteria, levels were too high to quantify. Nevertheless, the researchers saw kids playing in the flood waters.
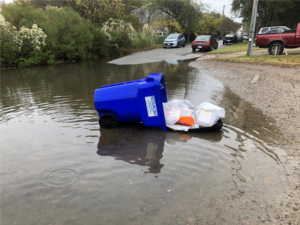
Recycling bin filled with trash falls over into flood waters in Norfolk.
In addition to nutrients and fecal contamination, trash, pet waste, oil, and other visible waste was being carried into the river by the retreating flood waters. “You see just everything,” Mulholland remarked.
She worries about how models of the Chesapeake Bay currently do not account for nutrient loading that results from flooding events. In 2017, Macias Tapia estimated that the nitrogen load delivered to the Lafayette River during this single flooding event was equal to the annual land based Total Maximum Daily Load (TMDL) established by the Environmental Protection Agency (EPA) for the Lafayette River. “If you hope to restore the Bay and you are not counting major sources of nutrients,” Mulholland explained, “you are going to be disappointed when the [restoration] actions you do take do not have the outcome you are hoping they will.”
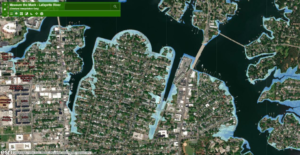
Inundation depths were extracted from GIS raster by Derek Loftis at VIMS using the data collected from Capture the King and corrected using LiDAR data.
Mulholland is working on securing funding to lead more sampling efforts by citizen scientists to better quantify nutrient loading from coastal flooding. “Most people are worried about the effects of coastal flooding on infrastructure and resources on land. People overlook that flooding affects the water too.”